Curtin Library Illuminates
Data visualisation / Unstacked
Inspiring connection, exploration, discovery and the creation of new knowledge
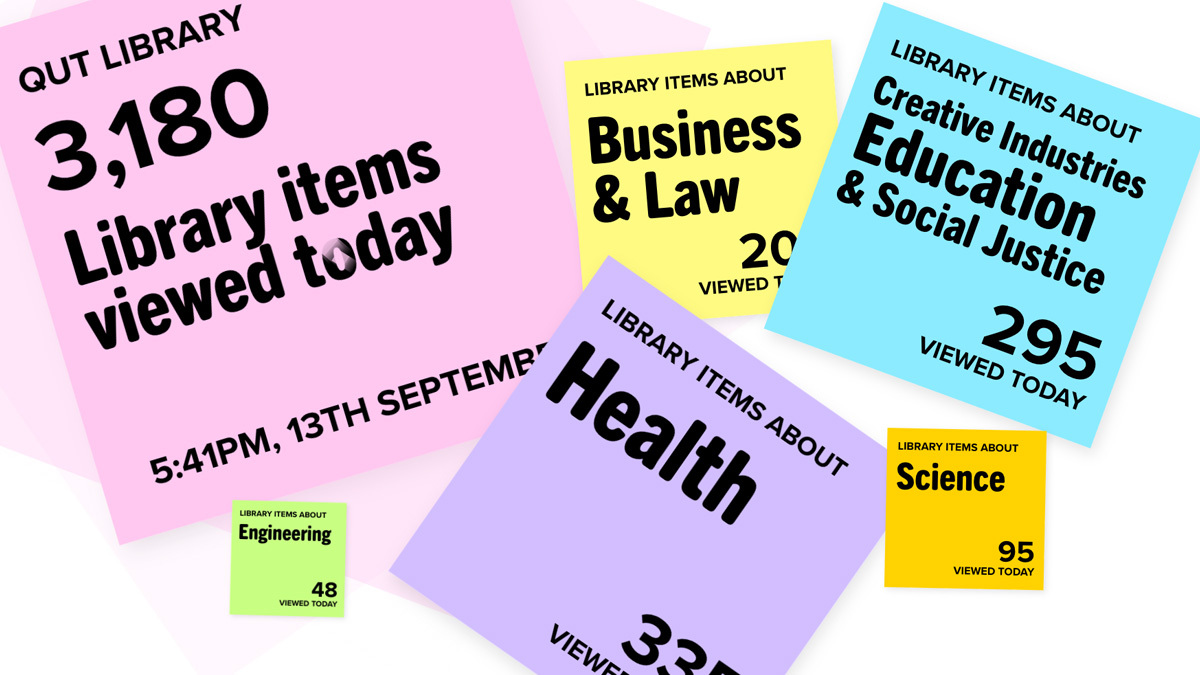
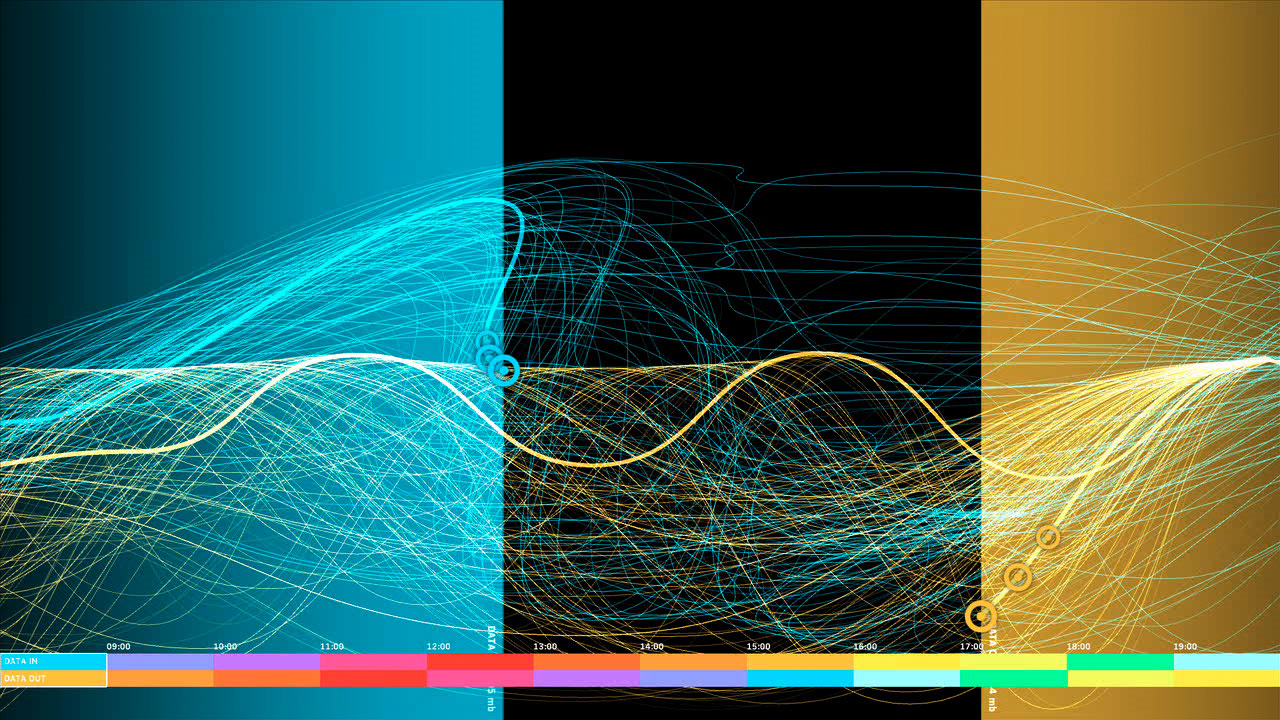
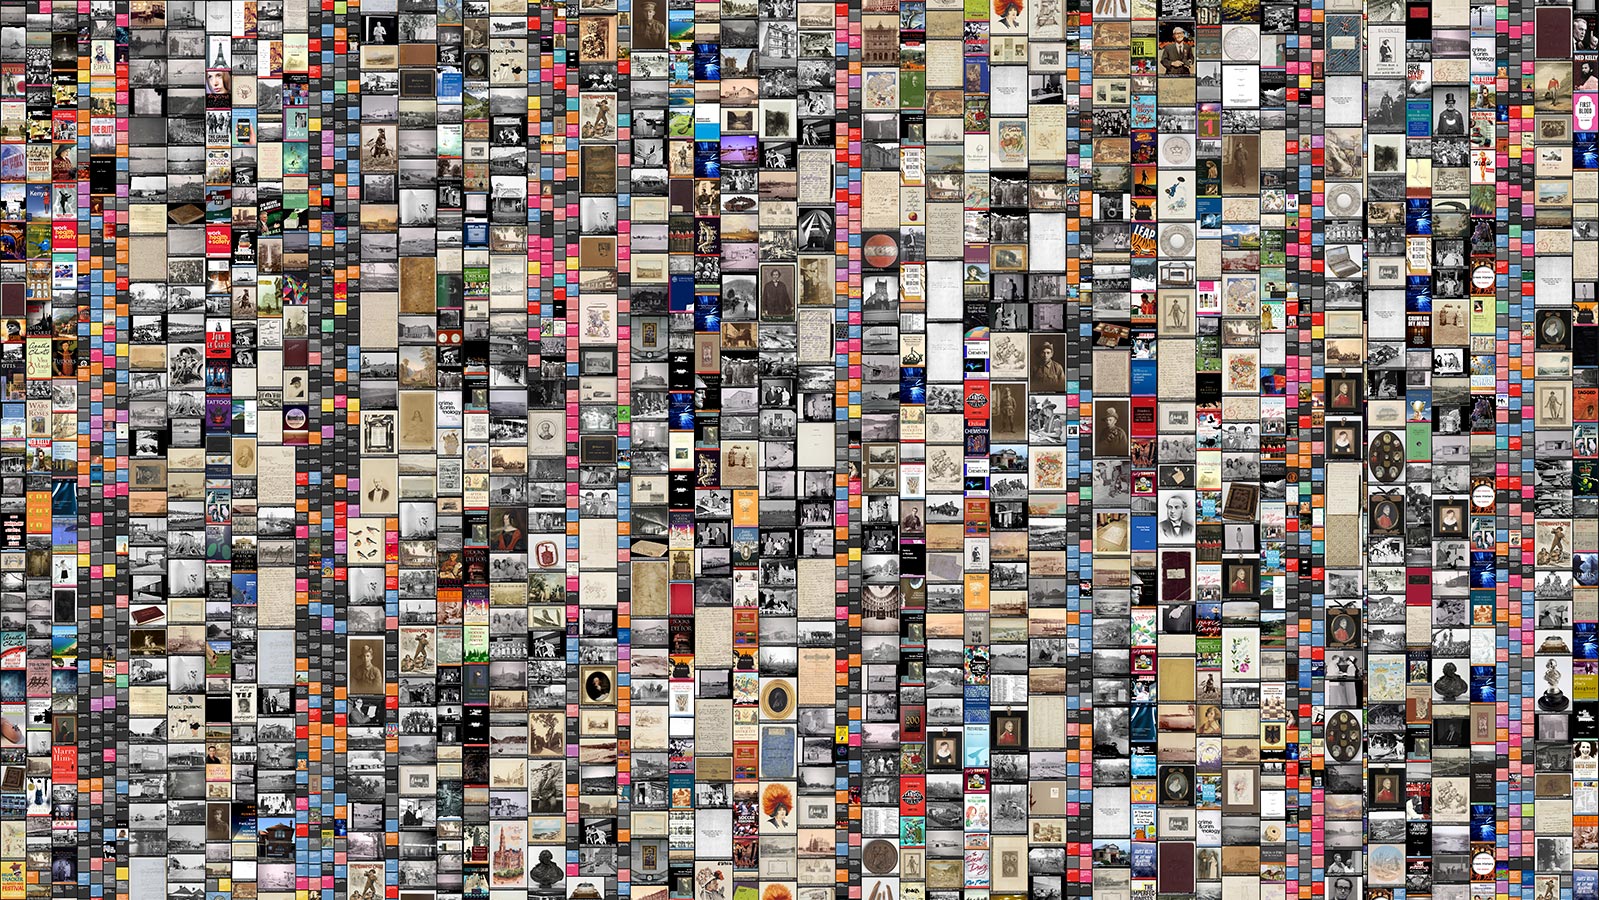
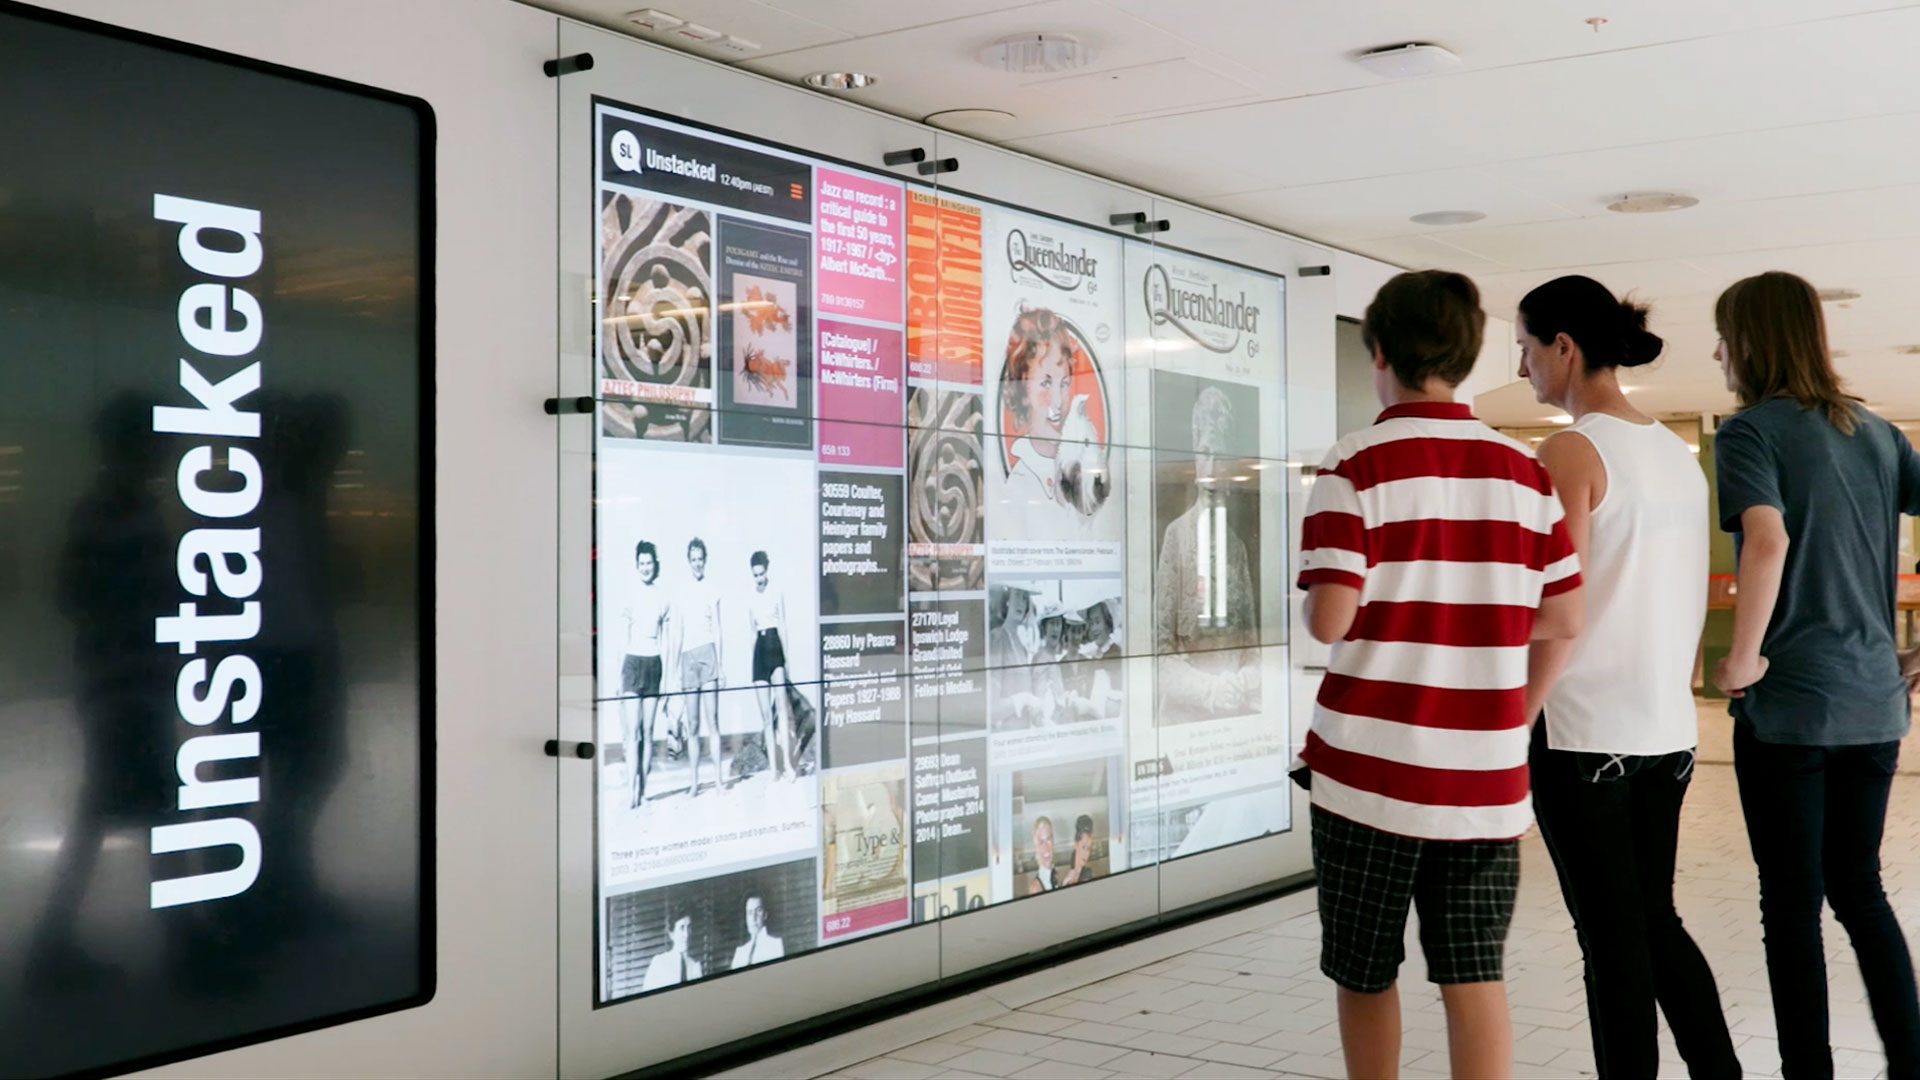
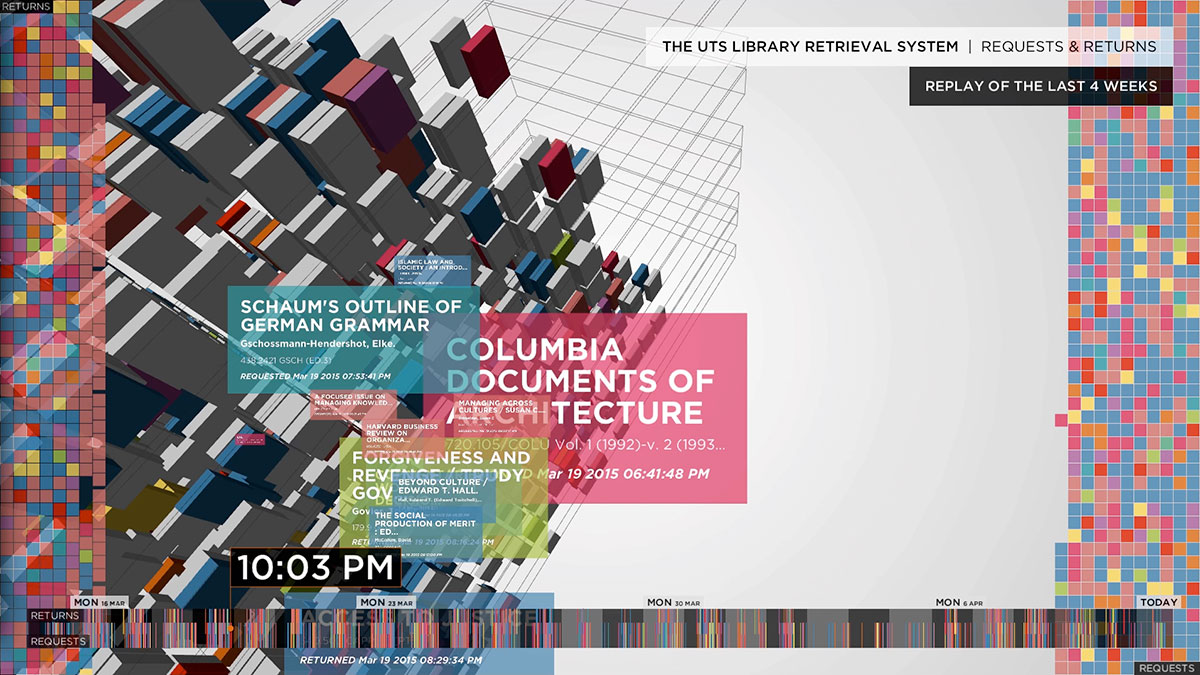
This real-time visualisation tells the story of how the University’s community is using the Library’s collection as it happens.
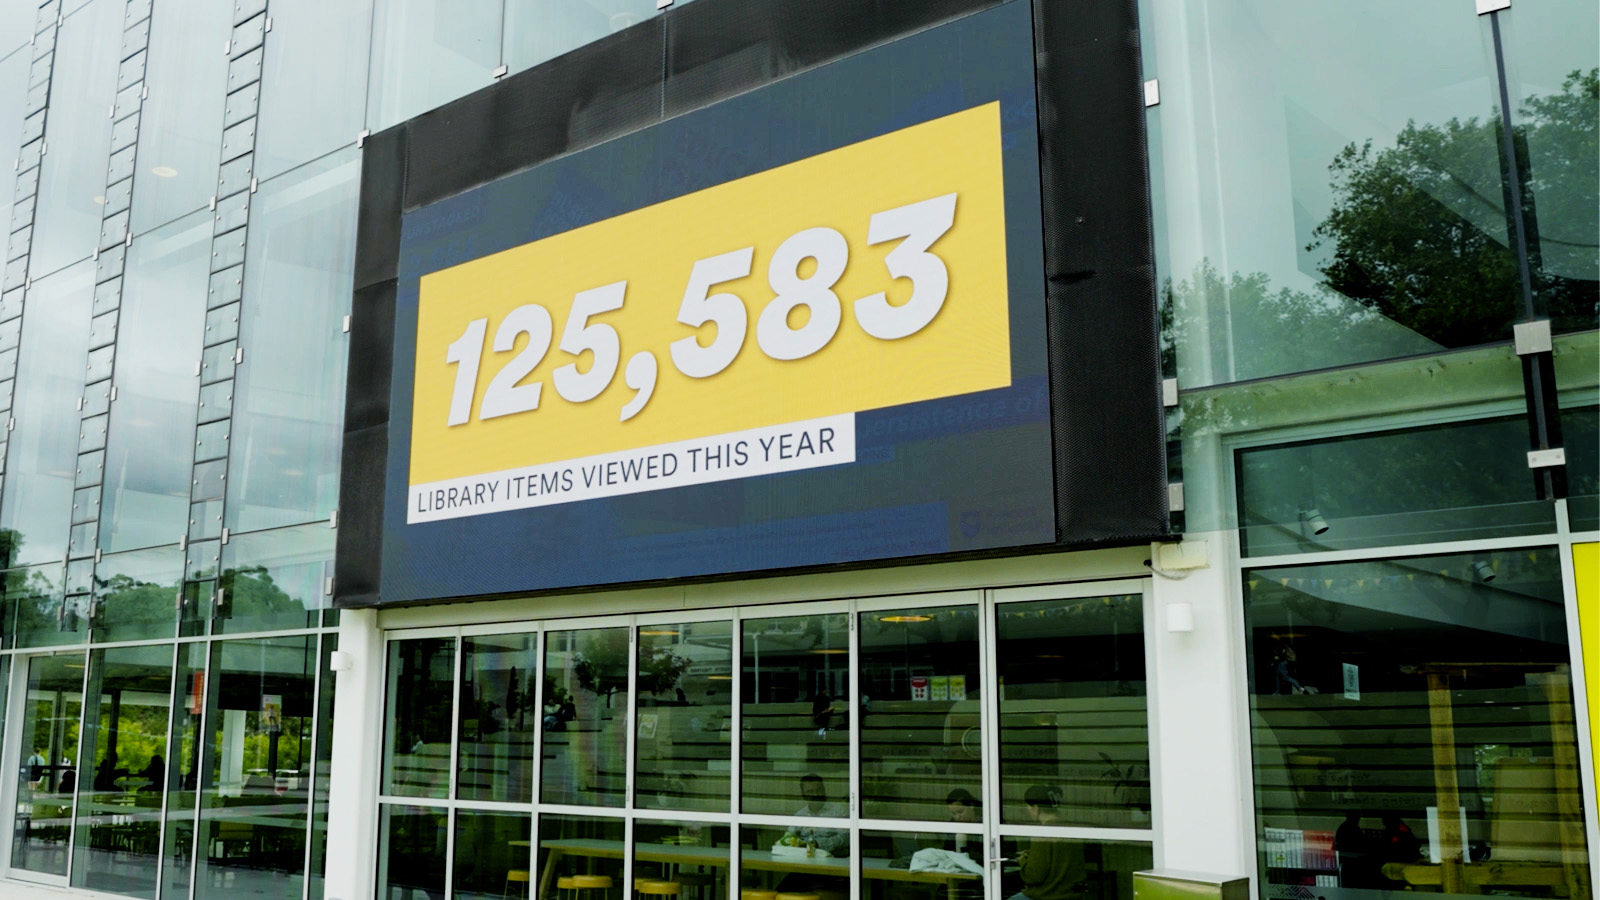
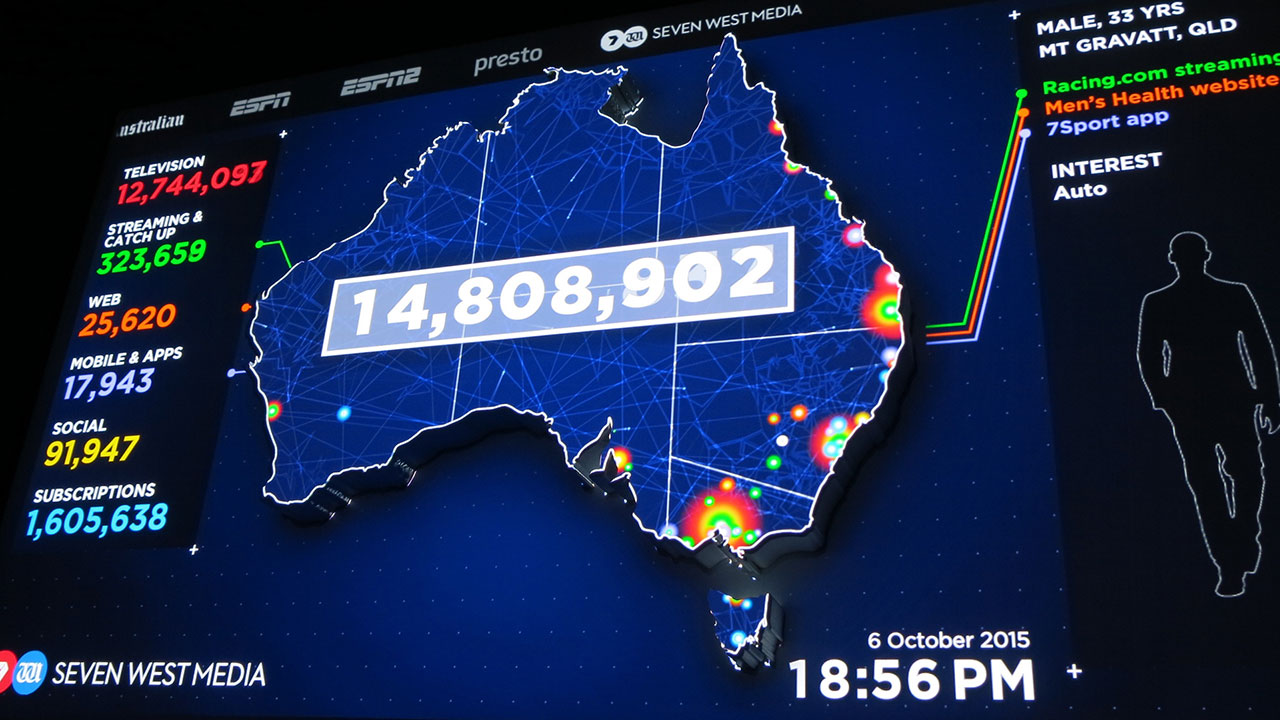
Whenever someone views an item on the online catalogue — whether a journal article, book, video or other resource — the interaction is represented by a coloured tile that flies in and lands on the relevant Study Area. A live count of catalogue interactions is displayed by Study Area, along with the total number of items viewed throughout the day. Together, these patterns reveal the dynamic relationship between the Library and research at individual, study area and university levels.
Library items are mapped to 12 study areas, with items that cannot be easily aligned to one of these areas added to a central tile.
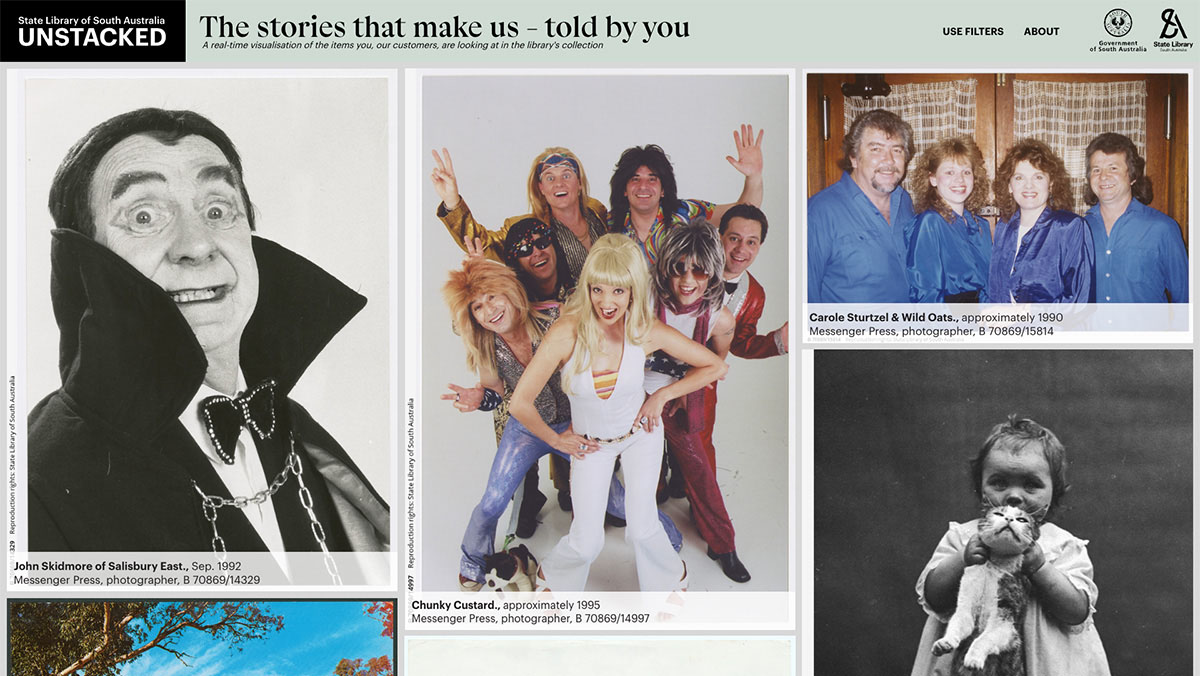
The project highlights the diversity of interests, materials and rhythms of use across the community — making research activity visible, discoverable and shared.
Wherever users may be — on campus, in regional WA, or across the world — their connection to the Library is valued.
“We are delighted with our Unstacked iteration in Curtin Library Illuminates”
Kylie Percival, University Librarian
Unstacked Project Team
Adam Hinshaw – Co-creator and Developer